Resources
Building Reports
Reports in Syntelic are highly customizable and allow for users to organize data in many ways. Below are some of the basic steps for creating reports and some of the various items that can be configured for each report.
CREATING A REPORT
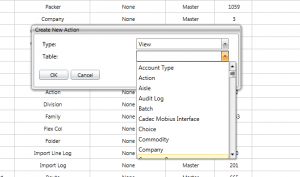
New reports can be created from the action view using the Create Action button, the green plus sign, which is in the top right of the screen. When creating a new action, you will need to choose a type and a table. For reports, choose an action type of view. The table dictates what columns are available and what data will be displayed. The most commonly used tables for reports are Route, Route Stop, Route Order and Route Event. Tables can also be created for items, drivers, tractors, and trailers.
EDITING AND CUSTOMIZING REPORTS
Columns
Reports can be modified by at any time by either right clicking on the action view and selecting Modify Row or clicking the Modify View button, the gray gear, in the top right.
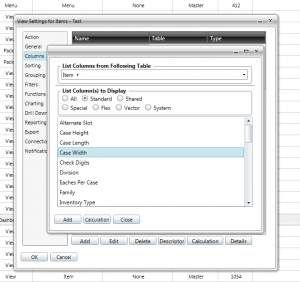
The first thing that needs to be added to the new report are columns. This can be done by going to the columns tab on the left of the Settings and then clicking add at the bottom. The columns associated with the table of the view will display first. Simply select which columns you want and click add at the bottom. The picture below is an example of what the columns for the item table would look like.
You are also able to drill down to other tables using the arrow to the right of the table name which is located at the top below “List Columns from Following Table.” For example, if the report was a Route report, you could also add columns from the Route Stop table and the Route Event table by following that path.
Calculations
It is also possible to add calculated columns to a report along with the columns that are associated with the table. To add a calculation column, follow the same steps as before but instead of selecting any columns click Calculation which is next to Add. This will create a blank column that you will be able to manually place a calculation in.
Once the calculated column has been added, select that column and then click calculation down below. This will open up the window that will allow you to select functions and modify the calculation. Every line of the calculation will use one of the functions that are present in Syntelic. These functions can range from the normal add, subtract, multiply, and divide to more complex items such as if statements and concatenations. Below is one example of what the setup for a calculated column would look like. This calculated column would look to see if the item ID for the row is equal to 123 and if so return a value of True.


Filters
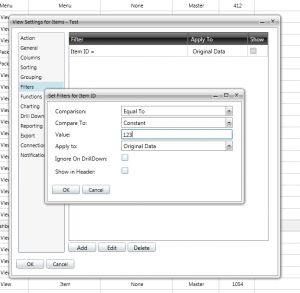
Reports can also have filters placed on them to help with displaying the data that is most critical to the user. Filters can be added for any of the columns that are on the report. When you add a filter you can specify a comparison such as greater than, less than, equal to, or not equal to. For example, if you were only interested in routes over 24 hours, you could add a filter on the route time column so that only routes that have a route time of greater than 24 hours would be returned when you run the report.
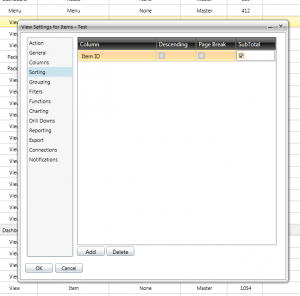
Sorts
Each report can also be sorted by any of the columns that have been placed on the report. There can be multiple sorts on a report with the sorts happening in the order they are listed on the sorting tab. Each sort that is added will sort that column in ascending order. This can be changed to descending on the sorting tab. Sub totals for a given column can also be added on this tab by just checking the subtotal box for the column that you are looking for.
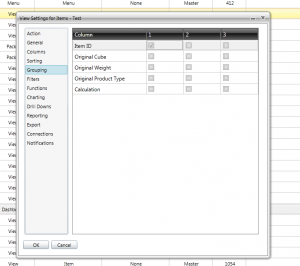
Groups
Each view can also have three levels of grouping for all of the columns. Grouping will take the raw data that is returned and roll up the columns that you selected. For example, a route event report could be grouped by driver and route. This would mean that instead of seeing every individual event, you would get a summary of the events by driver and route.