Resources
Your Trucking Dashboard—the Nerve Center of Your Logistics Operation
If you’re running a trucking operation, efficiency is everything. The larger your fleet is, the larger the impact you’ll see from even small increases in efficiency.
Consider these examples:
- You have 100 trucks covering planned routes of about 150 miles a day, five days a week. If you trim seven miles from each route, you’ll save about a gallon of fuel per route per day. At $3.80 per gallon for diesel, that small change will save you almost a hundred grand in fuel costs over the course of a year:
100 trucks × $3.80 per day × 5 days per week × 50 weeks per year = $95,000
- If you want to grow your business, you might consider adding trucks to your fleet. But what if you can serve more customers without adding any more trucks? Suppose your 100 trucks spend four hours and forty minutes each day on eight stops. Figure out how to shave just four minutes off of the service time for each customer, and you can add a ninth stop to each route.
But to incrementally improve your operational efficiency in this way, you need reliable, up-to-date information on everything from load and route plans to scheduled vehicle maintenance and driver service hours.
A trucking dashboard in Syntelic’s Transportation Analytics software gives you this kind of actionable data, placing key reports at your fingertips.

Dashboards: From Horse-Drawn Carriage Mudguard to Software Command Center
According to Merriam-Webster’s online dictionary, the first use of the word dashboard was in 1842, and it referred to “a screen on the front of a usually horse-drawn vehicle to intercept water, mud, or snow.”
As the automobile was developed in the early 20th century, designers replaced teams of horses with internal combustion engines—but they retained the dashboard. The forward-facing surface of the dashboard still blocked water and mud from being flung onto passengers, but the rear-facing, interior surface was initially empty.
Manufacturers added gauges and instruments to the dashboard as vehicle design became more sophisticated. In time, the word dashboard took on a new meaning: “a panel extending across the interior of a vehicle (such as an automobile) below the windshield and usually containing instruments and controls.”
Today, software manufacturers (like us) create dashboards within applications like Transportation Analytics to give users easy access to essential functions and information.
Let’s explore how Syntelic’s trucking dashboards are the nexus of our Route Planning, Load Planning, and Transportation Analytics programs and how their powerful ad hoc reporting features and our customer-friendly we-do-it-for-you approach to support business growth, operational efficiency, and greater customer satisfaction.
Optimizing Your Transportation Operation
For elite athletes and musicians, practicing with a coach is a routine part of performing at the highest level. Quarterbacks drill the mechanics of throwing, learning to position their bodies for a quick release and maximum power and accuracy on their passes. Violinists play simple scales to fine-tune finger placement so that virtuosic passages flow beautifully and effortlessly.
Syntelic’s software brings the same approach to transportation logistics. Each of our primary software modules helps you track performance and hone your business processes to a razor’s edge:
- Syntelic Route Planning allows you to schedule optimal routes with dynamic route planning, saving time and reducing fuel expenses.
- Syntelic Load Planning turns out load plans optimized for variables like vehicle weight, axle weight, loading and unloading efficiency, and minimizing over, short, and damaged (OS&D) orders.
- Syntelic Transportation Analytics pulls in data from Route Planning and Load Planning and interfaces with your fleet on-board diagnostic (OBD) data to give you near-real-time information on every aspect of your operation.
With Syntelic software, you can continuously improve route and load planning, warehouse practices, driver utilization, vehicle maintenance, employee training, and other aspects of your operation. Simultaneously, you can follow the way each operational change affects performance. This leads to reduced costs, higher revenue, and the capacity to serve more customers—a great return on investment.
The Syntelic Way: No Cookie-Cutter Software Implementations
Each implementation of our software is unique, just like your business. So we take time to get to know your business and tailor your Syntelic software to your specific needs. No one knows better than you what metrics you need to track to keep your trucking outfit competitive and profitable.
The Syntelic Way: We-Do-it-for-You Support
Most transportation management systems (TMSs) or OBD companies provide reports—usually a standard set of static reports. Customers often pay steep fees for custom reports—and if their needs change, they pay for revisions, too. We’ll create reports that give you the information that matters to you, and if you need changes later on, we’ll make them for you—free of charge.
Ad Hoc Reporting
When we implement your Syntelic software, we’ll teach you and your staff how to use it. Your training will include creating your own ad hoc reports: Filter, sort, calculate, and display the information you need, when you need it.
Visualize Your Trucking Data
Many TMS and OBD companies provide reports in table form—dumping a week’s worth of route statistics into an Excel spreadsheet, for example. The information is there, but it may run to hundreds or thousands of lines, making it difficult to extract what you need.
With Syntelic’s reports, you can do more than view the results in a table; you can see your data in bar graphs, pie charts, and other visual formats. One picture may be worth more than a thousand lines of spreadsheet data.
Syntelic Trucking Dashboards: Where it All Comes Together
When we set up your Syntelic transportation logistics system, everything comes together on your main dashboard, where you can easily access your most essential reports. You can set this dashboard to refresh as often as every five minutes, giving you a near-real-time snapshot of your daily operations.
Items on your dashboard are more than static displays; they’re interactive, nested reports you can filter and sort to access increasingly specific information. At the click of a mouse, you can open subsidiary dashboards for things like route costs or driver scorecards.
Example 1: Route Cost Trucking Dashboard
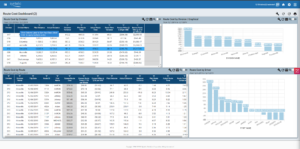
Suppose you follow a link to a route cost report on your main Syntelic software dashboard. The above screen opens—your route cost dashboard.
- At the top left, a chart shows route cost by division, filtered by date (one week in December). This provides detailed information for each division.
- At the top right, the same information is summarized graphically; at a glance, you know that Fayetteville is far outperforming Richmond.
- The bottom left is a drill-down showing detail for Knoxville, which is selected (in blue) in the chart on the top left.
- The bottom right is a graphical comparison of driver performance for the Knoxville division.
Example 2: Driver Scorecard Trucking Dashboard
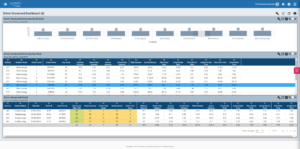
The above screenshot shows a Syntelic driver scorecard dashboard.
Driver scorecards use OBD driving data and other performance factors to rate drivers, singling out deserving employees for either praise or disciplinary action. They can also help you zero in on areas where training or education is needed to boost performance.
This example uses a simple scorecard that awards 25 points for each of four categories (distance, service, route time, and drive time) for a maximum possible score of 100.
- The graph at the top shows average scores for ten different divisions, and it’s immediately clear that most of the scores are bunched within a relatively small range.
- The middle drill-down chart shows scores by driver for one division (Chattanooga) for one week in December.
- The bottom drill-down (opened by selecting one driver from the chart above it) gives details on Driver 047025’s performance.
These examples illustrate how Syntelic’s interconnected, interactive reports, consolidated on your primary trucking dashboard, give you a minute-by-minute, trustworthy display of your fleet’s performance, from a bird’s-eye view down to the level of a single employee.
When everyone uses the same continuously updated system—from headquarters down to each warehouse—everyone is clear about where your business is excelling and where you need to improve.
Contact Syntelic Today
Whether you’re driving a truck or running a trucking business, you need a dashboard in front of you—easy-to-use yet sophisticated tools that give you confidence that you’re in control and headed in the right direction.
Contact Syntelic today to talk with us about what you want on your trucking dashboard.